| Method:. |
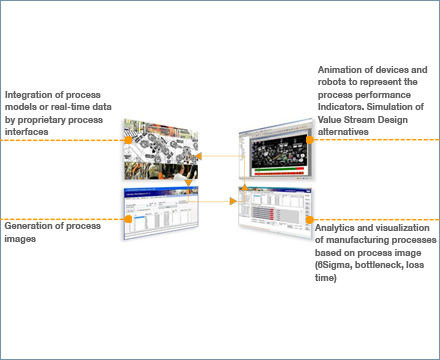
 So, how does robmax create this picture of the opportunity? It is through the translation of real time data into a Process Image. For each technology of fabrication (gluing, welding, measuring etc), data is intelligently combined to create a virtual picture of the processes and their relationships. So, how does robmax create this picture of the opportunity? It is through the translation of real time data into a Process Image. For each technology of fabrication (gluing, welding, measuring etc), data is intelligently combined to create a virtual picture of the processes and their relationships.
This process image enables robmax to run an analysis with 6 Sigma methodologies on loading, efficiency, robustness etc. to create both a Dominating Station Graph (DSG) to show which robot is driving the operation, as pace maker and a Value Stream Map (VSM) to identify the lost time increments inherent in the operations. Now one can see both the cause and effect in ways the naked eye and stop watch cannot display. By demonstrating the functioning of the components of the value chain through the VSM, we can make the efficiency leaks visible and actionable. Actionable means understanding the functions of the value chain as they are now and what effect any proposed actions would have, without risking current production. Thus robmax deploys a standard simulation software which utilizes the robmax Simulation Templates to answer the „what if“ questions. Now you can play with the variables in a sterile environment and fashion processes that will deliver the solutions to realizing the opportunity first made visible through the real time data feeds. With use of real time process data, one can complete the loop from the digital factory to the production floor and back to the digital factory – feedback is now constantly available to validate decisions taken to improve automation performance for current operations or new model introductions.
|
 Method
